
Introduction
Every growing business has one spreadsheet that quietly runs half the company. It tracks inventory, or approvals, or onboarding, or all three. Nobody remembers exactly when it became load-bearing. It just did, one workaround at a time.
We’ve sat across the table from enough operations leads to know the sentence that usually comes next: “it’s just a spreadsheet, it works fine.” That sentence is rarely wrong in the moment. It’s wrong on the balance sheet, months later, when someone finally adds up what that spreadsheet is actually costing.
This post does that math. Not in abstract percentages, but in hours, error rates, and dollars a 10 to 50-person team can actually plug into their own numbers.
Why Manual Operations Feel Free (And Aren’t)
Manual processes don’t show up as a line item anywhere. There’s no invoice for “time spent re-typing the same order into three systems” or “hours lost reconciling two versions of the same file.” That invisibility is exactly why manual operations survive so long inside growing businesses. The cost is real, it’s just distributed across dozens of small moments that nobody bothers to track.
A recent analysis of SME financial management found that 80% of small and mid-sized businesses still rely on manual processes for core financial workflows, with 38% citing data entry errors and 36% reporting payment delays directly tied to manual approval chains.¹ Those aren’t edge cases. That’s the default state for most businesses in the 10 to 50-employee range, whether or not they’ve already adopted a CRM or accounting tool for one part of the business.
The three costs below are the ones we consistently see driving the real number, and they compound each other rather than sitting side by side.
The Three Hidden Costs of Manual Operations
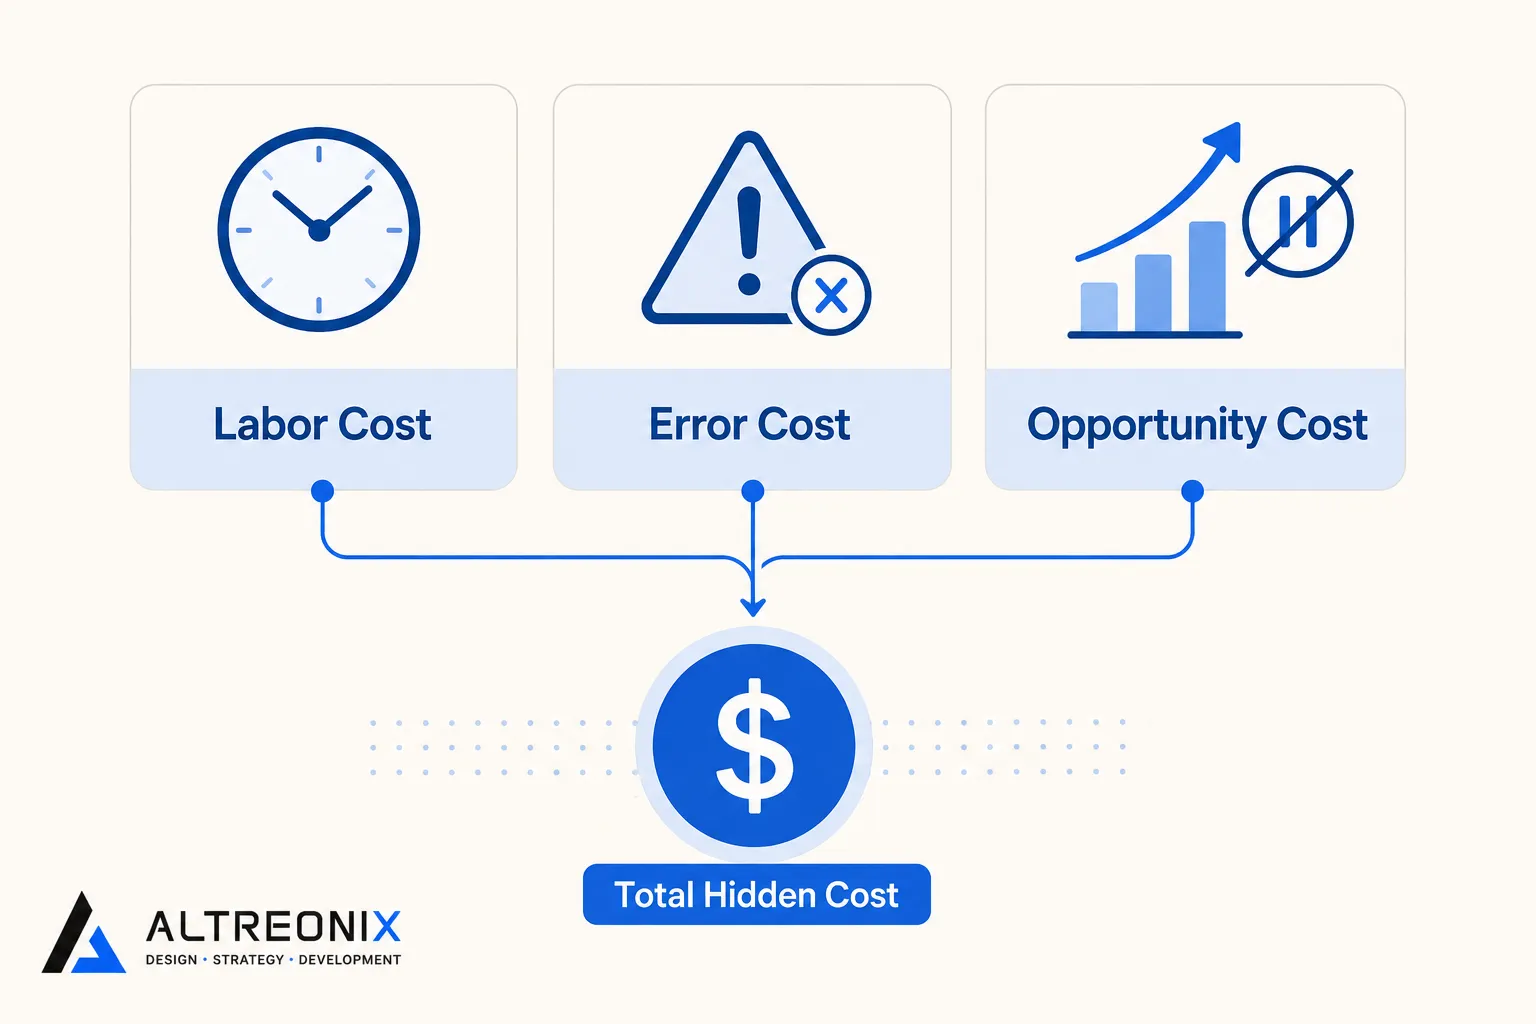 ### Labor Cost: The Hours You Don’t See on Any Invoice
This is the most direct cost and the easiest to underestimate, because it’s spread across everyone rather than concentrated in one role. Order entry, status chasing, approval follow-ups, manual data re-entry between tools, and “let me just double check that spreadsheet” moments all draw from the same pool of hours.
Industry estimates on manual workflow overhead put the fully loaded cost as high as the tens of thousands of dollars per employee per year once coordination time, re-entry, and status-chasing are added up across a team.² For a 10-person operations team, that compounds fast, because the overhead doesn’t scale down with headcount. A 10-person team spends nearly as much time on coordination overhead per person as a 50-person team, since the underlying process, not the headcount, is what’s broken.
Error Cost: What a Small Mistake Rate Actually Means at Volume
Manual data entry typically carries an error rate of roughly 1 to 5% per field, depending on the complexity of the data and how many times it gets re-typed across systems.³ On a single order, that sounds trivial. Across a few hundred orders a month, each touching multiple systems, that error rate turns into a steady stream of corrected invoices, re-shipped orders, and reconciliation calls with customers or vendors.
The cost isn’t just the fix. It’s the trust cost with a customer who got the wrong shipment, and the internal cost of someone spending an afternoon figuring out where the number diverged between the spreadsheet, the accounting tool, and the inbox.
Opportunity Cost: What Your Team Isn’t Doing Instead
This is the cost that never appears in any audit, and it’s usually the largest one. Every hour spent manually reconciling a spreadsheet or chasing an approval over email is an hour not spent improving a process, training a new hire properly, or working on the handful of things that actually grow the business.
Operations teams running on manual workflows tend to operate in permanent maintenance mode. The work gets done, but nothing gets better, because there’s no slack left to invest in getting better. That’s a growth ceiling hiding inside a spreadsheet.
A Simple ROI Formula You Can Run This Week
You don’t need a consultant to get a directionally correct number. This formula works with numbers you likely already have or can estimate in ten minutes:
Manual Operations Cost = (Hours spent on manual tasks per week × hourly cost of labor × 52) + (Error rate × transaction volume × average cost per error)
Walk it through with rough numbers:
- A 20-person team spends roughly 8 hours per week per person on manual data entry, status chasing, and reconciliation across inventory, approvals, and onboarding tasks.
- Average fully loaded hourly cost: $35.
- Weekly labor cost: 20 people × 8 hours × $35 = $5,600 per week, or roughly $291,000 per year, before a single error is factored in.
- Add a conservative 2% error rate across 500 monthly transactions, at an average cost of $40 per error to fix: 2% × 500 × $40 × 12 = $4,800 per year.
That’s a rough $296,000 annual number for a 20-person team, and it doesn’t include the opportunity cost of what that time could have gone toward instead. Separate analyses of automation payback consistently find businesses recovering 40 to 70% of that time once the highest-friction workflow is automated or systematized, typically within a 3 to 6 month payback window.⁴
What This Looks Like at Different Team Sizes
The formula scales differently than most people expect, because coordination overhead per person doesn’t shrink as headcount grows until a real system is in place.
| Team Size | Est. Weekly Manual Hours | Est. Annual Labor Cost | Est. Annual Error Cost | Est. Total Annual Cost |
|---|---|---|---|---|
| 10 employees | 70 hours | ~$127,400 | ~$2,400 | ~$130,000 |
| 25 employees | 175 hours | ~$318,500 | ~$6,000 | ~$325,000 |
| 50 employees | 320 hours | ~$582,400 | ~$12,000 | ~$594,000 |
These figures assume the same $35 average hourly cost and error assumptions used above, scaled to headcount. Your actual numbers will shift with your labor cost and transaction volume, which is exactly why running your own version of the formula matters more than any industry benchmark.
Three Places This Cost Shows Up in Practice
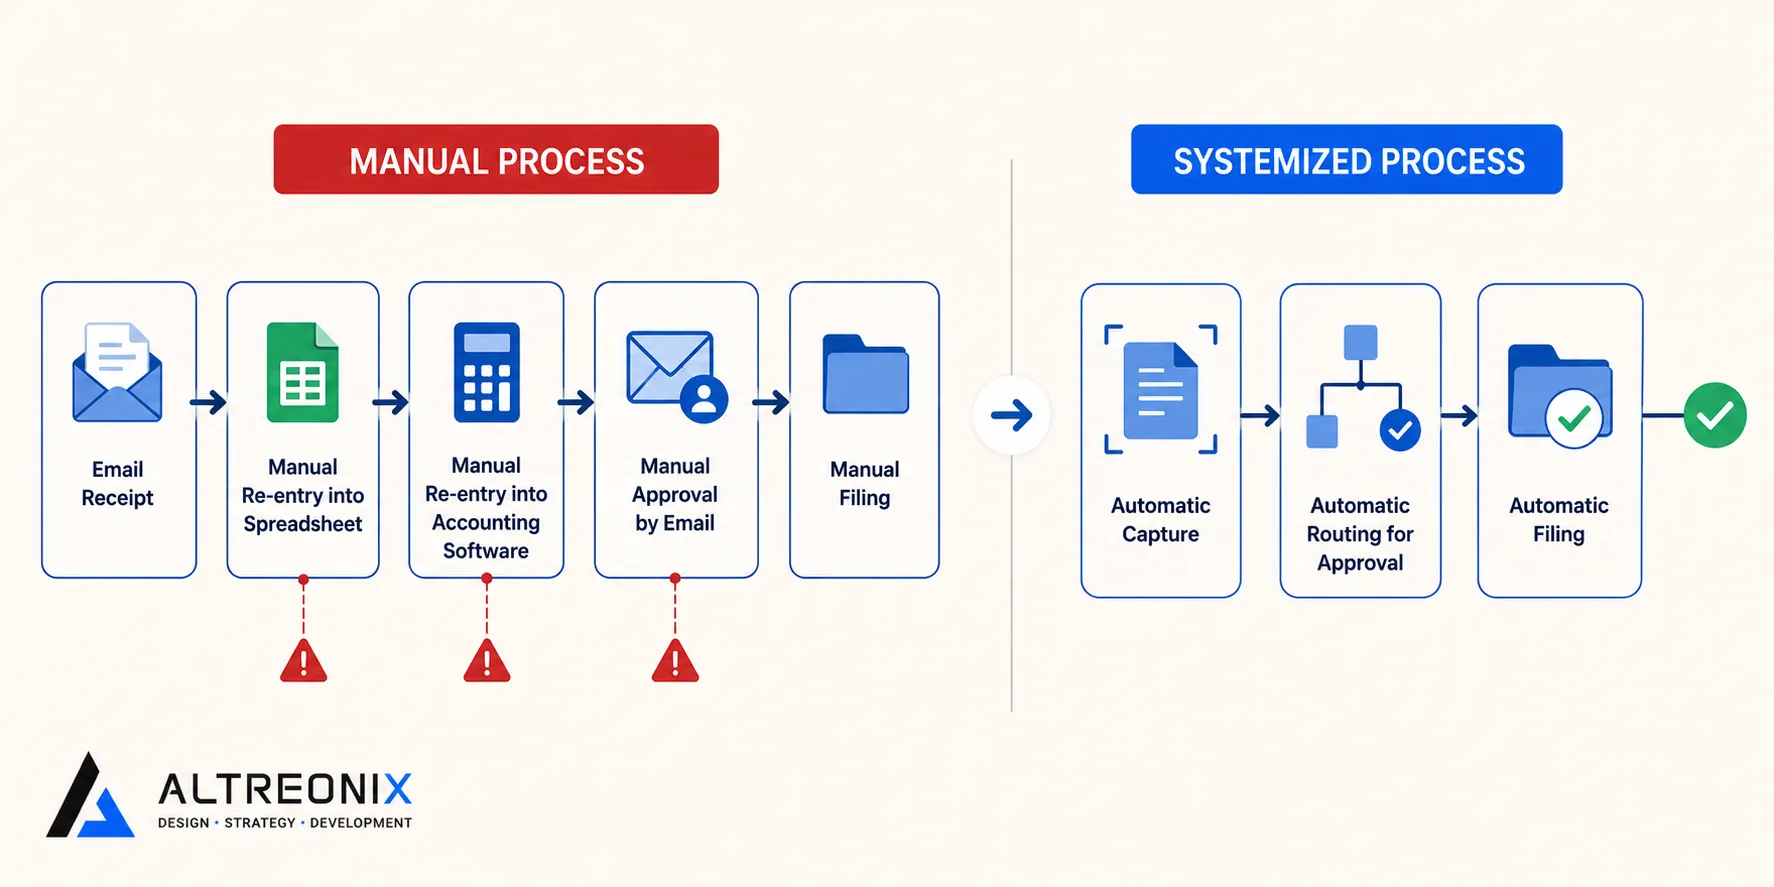
Invoice processing. A manually processed invoice moves through multiple people, multiple tools, and at least one spreadsheet before it’s paid or filed. Each handoff is a chance for a typo, a missed field, or a delay. Reports on manual financial workflows consistently link this pattern to late payments and reconciliation backlogs, not just occasional errors.¹
Order processing. An order that gets manually re-typed from an email or form into an inventory sheet, then again into an invoicing tool, accumulates risk with every transfer. This is where the 1 to 5% per-field error rate compounds into the kind of mistake a customer actually notices.³
Approval chains. A budget or vendor approval sitting in an email thread has no visible status, no audit trail, and no way to flag that it’s been sitting for four days. The delay itself is a cost, separate from any error, because whatever depended on that approval is also waiting.
 ## Where This Money Actually Goes When You Fix It
The point of running this math isn’t to feel bad about a spreadsheet. It’s to reframe the decision. Building a proper system for inventory, approvals, or onboarding isn’t overhead. It’s usually cheaper than the manual process it replaces, once labor, error, and opportunity cost are counted honestly.
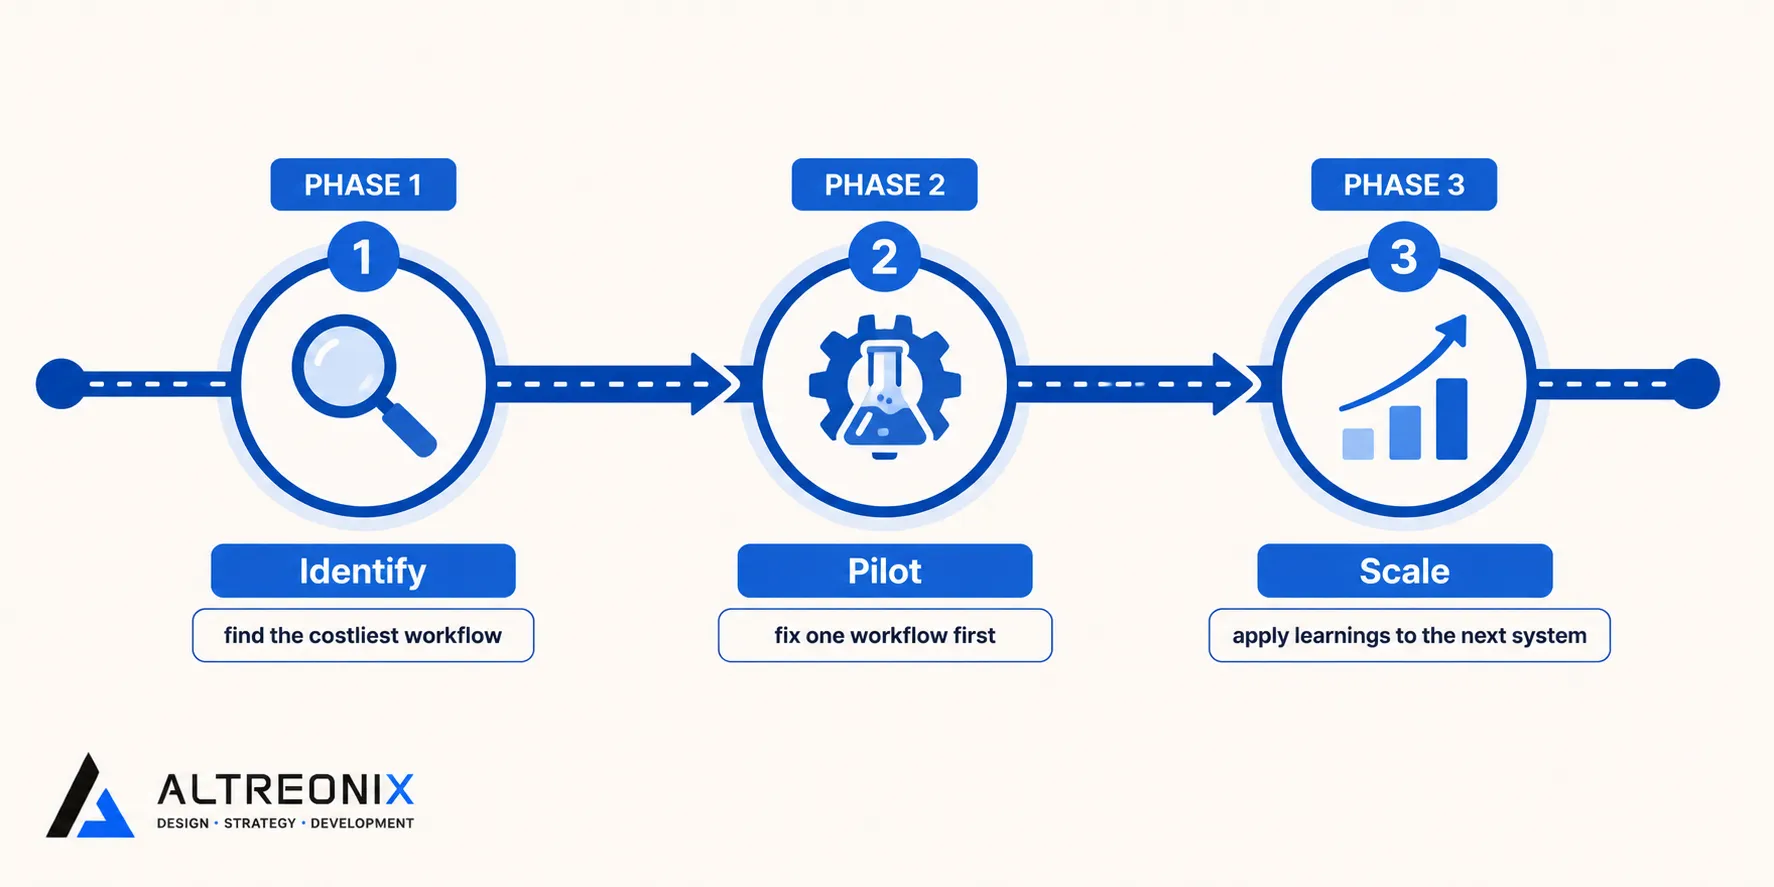
This is also where the type of fix matters. Full replacement of every tool is rarely the right first move, and it’s rarely what actually pays back fastest. In our experience, the highest-leverage move is systemizing the single workflow causing the most damage first, whether that’s inventory, approvals, or onboarding, rather than attempting a company-wide overhaul in one pass.
 For teams not ready to replace core tools yet, lightweight automation that connects the systems you already have can capture a meaningful share of this cost without a full migration. We’ve written before about the architectural choice between event-based and CRUD-based automation, which becomes relevant the moment you start automating any of the workflows above, since approvals and order processing behave very differently from a real-time trigger.
The right starting point is almost never “replace everything.” It’s identifying which single manual workflow is costing the most, using the formula above, and fixing that one first.
If this math looks familiar, the next step is usually a quick, structured look at where your specific hours and errors are concentrated. We offer a Manual Operations Cost Assessment where we walk through your actual workflows, apply this formula to your real numbers, and flag the one or two systems worth fixing first. Book a conversation with us and we’ll bring the framework, you bring the numbers.
References
1. OFX, “The State of SME Financial Management in Australia 2025,” https://www.ofx.com/wp-content/uploads/2025/11/The-state-of-SME-financial-management-in-Australia-2025.pdf
2. USTech Automations, “Business Workflow Automation: Save 15 Hours Per Week,” https://ustechautomations.com/resources/blog/business-workflow-automation-save-15-hours-per-week
3. Sightsource, “AI Workflow Automation,” https://www.sightsource.net/insights/ai-workflow-automation/
4. BuiltwithTech, “The Real Cost of Manual Workflows,” https://www.builtwithtech.io/blog/real-cost-manual-workflows-automation and Automation Atlas, “Workflow Automation ROI Benchmarks,” https://automationatlas.io/guides/workflow-automation-roi-benchmarks/